LINCam

Photon detection and counting camera that is perfect for FLIM and Light Sheet Microscopy applications.

Description

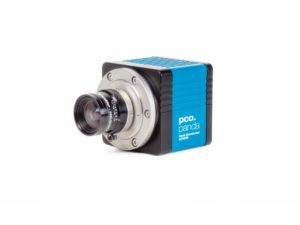
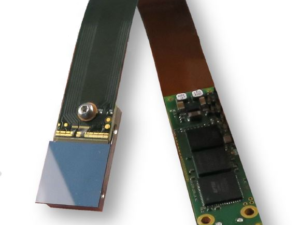
Single photon detection System

Photon counting is the only way to get as much information brought by light as it is physically possible. Here we present the system allowing to detect not only arrival time of individual photons but also a position as straightforward as camera. Standing on the shoulders of night vision technology LINCam allows to extend any simple wide-field microscope to the powerful fluorescence lifetime imaging system.
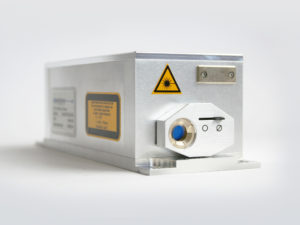
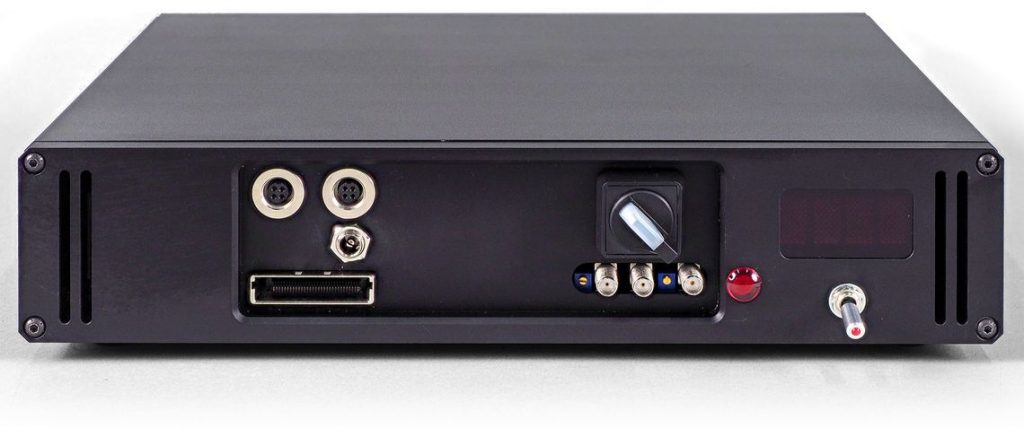
Acquisition System

Everythng one needs for robust and reliable single photon counting in a single box. The acquisition system integrates time to amplitude converter, analog to digital converters, power suppliers, reference signal constant fraction discriminator and more. Just plug it to USB 2.0 port.

LINCam
Active area diameter, mm17
Positional resolution, pixels1000 × 1000
Temporal resolution, ps FWHM≤ 40
Microscope mountC-mount
Housing dimentions, mm145 × 78 × 50
Weight, g500
CoolingLiquid cooled
Single photon acquisition system
Maximal count rate, MHz1
Dead time, ns400
Timing methodTAC + ADC
Minimum bin width, ps1
Electrical resolution, ps, FWHM7
Number of bins4096
Reference inputPositive or negative NIM
Time tagging resolution, ns10
Computer interfaceUSB 3.0, Ethernet
Time tagging resolution, ns10

Click here to download the datasheet

Glycolytic oscillations in eukaryotic cells followed by NADH imaging

Monitoring intrinsic energy metabolism over long periods of time allows the study of cellular communication between cell populations. By using the metabolite NADH as an intrinsic marker for glycolysis, the dynamics of individual cells can be monitored and their interactions studied. Glucose consumption by glycolysis and alcoholic fermentation leads to the production of metabolites, some of which are released. Coupling between yeast cells depends on the release and sensing of the messenger acetaldehyde, which diffuses through the extracellular medium. Yeast cells are well known for the oscillatory behavior of the glycolysis and their metabolic organization. The exchange of messenger molecules can result in waves and synchronized patterns in which all cells oscillate in concert. Essential to this study is an ultrasensitive detection system that allows excitation of the weak fluorescence of NADH by low-intensity UV light.

Click on the link below for read more:

Fluorescence Lifetime Imaging (FLIM)

Example of lifetime imaging of a lily of the valley slice sample. The intensity image (a) is a histogram of the positions of acquired photons. Lifetime analysis reveals four lifetime components: τ1 = 0,19; τ2 = 0,67; τ3 = 1,95 and τ4 = 3,75 ns. The resulting overlay image (b) of the intensity image and average lifetime is shown.

Click on the link below for read more:

FLIM (Fluorescence Lifetime Imaging)


You may also be interested in:

Subscribe to our mailing list